“A difference is a difference only if it makes a difference.”
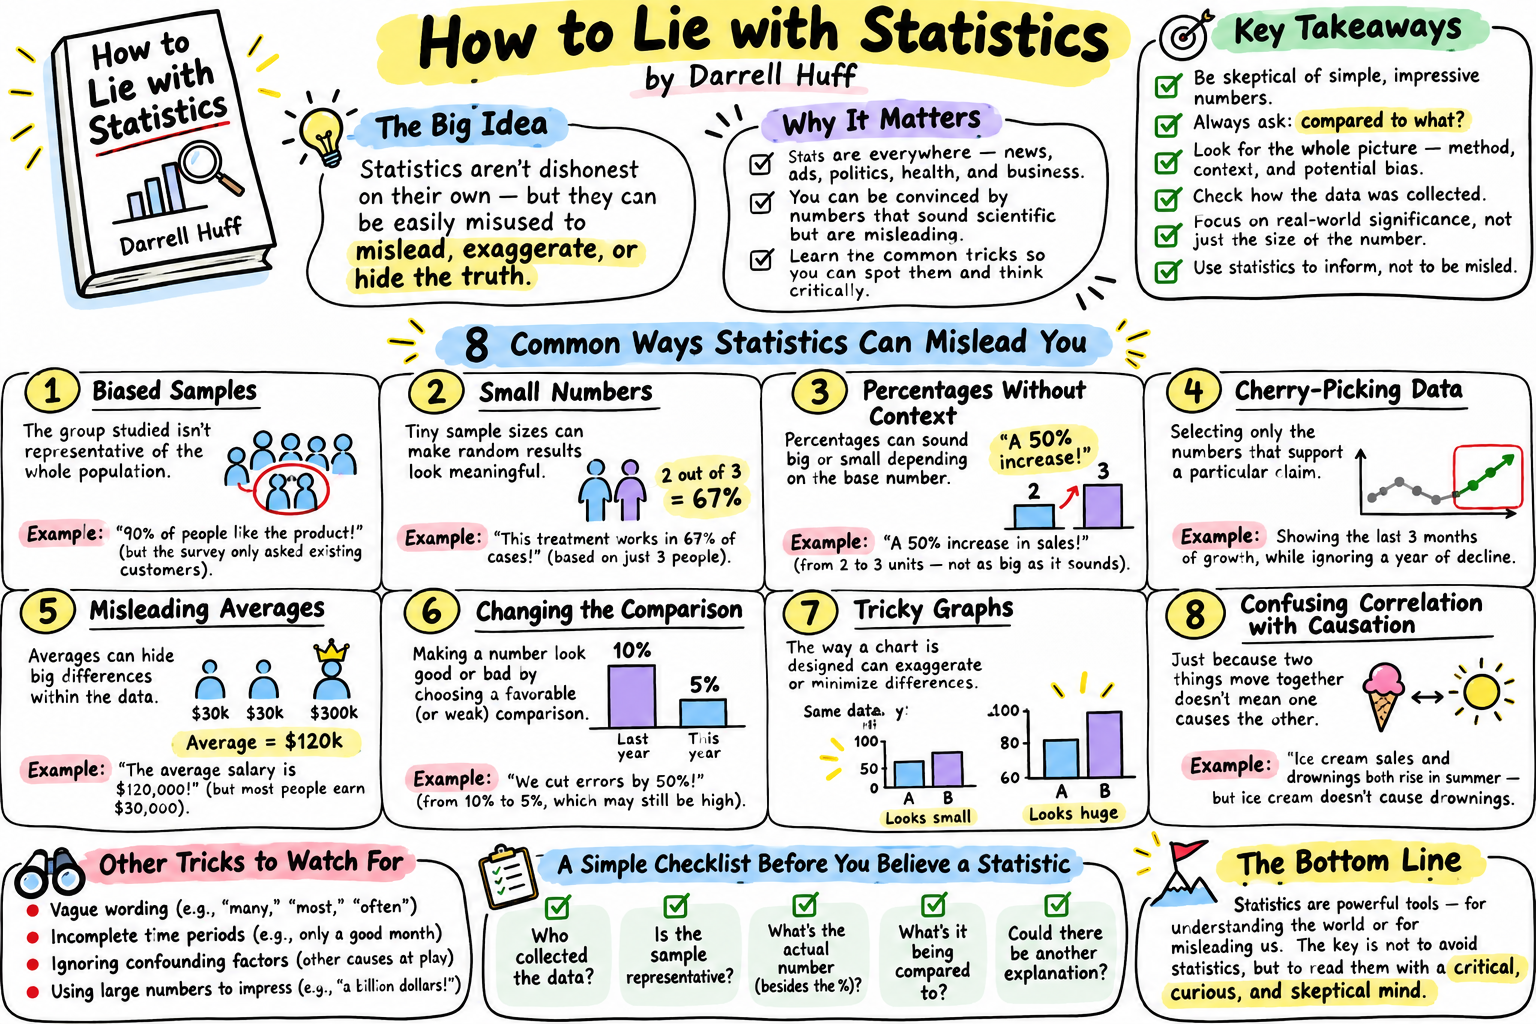
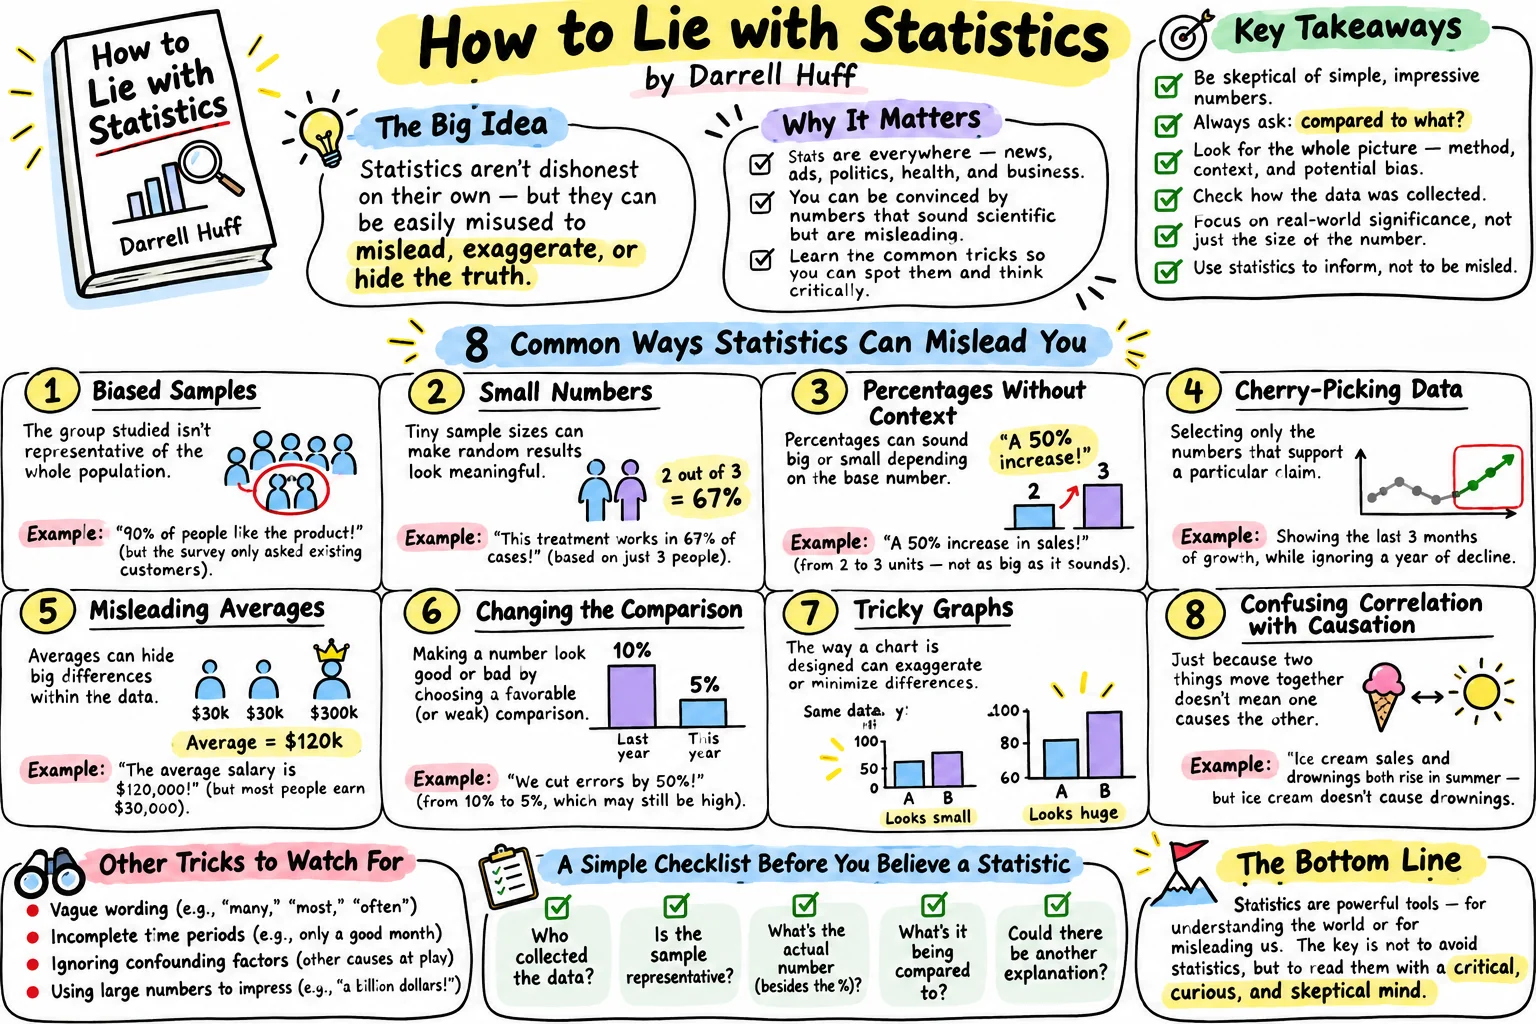
The short answer: Here’s the How to Lie with Statistics summary. Darrell Huff’s 1954 book shows how true numbers get used to mislead: biased samples, cherry-picked averages, missing comparisons, stretched graphs and cause-and-effect leaps. It ends with five questions to ask of any statistic. Seventy years on, the same tricks show up in drug ads, food science and wellness ads.
You’ll learn Huff’s main tricks, most with a real health example. You’ll see why the author’s own story is a warning. And you’ll get a two-minute checklist for the next diet or drug headline.
What Is How to Lie with Statistics About?
How to Lie with Statistics is a short, funny guide to the ways honest-looking numbers fool people. W. W. Norton published it in 1954, with cartoons by Irving Geis. It has sold over 1.5 million copies in English, per Wikipedia, and became a standard college introduction to statistics in the 1960s and 1970s.
The title is a joke. Huff writes it like a con artist’s manual so you’ll recognize the con. His word for the craft is “statisticulation”: misinforming people with statistical material, as the ALiEM book club puts it.
Most of the tricks don’t need a single false number. That’s what makes them work.
Action item: Find one health claim on a label or ad near you today. Ask: is this number false, or just framed?
Who Was Darrell Huff, and Why Does His Story Matter?
Huff was a magazine editor and writer, not a statistician, and he later took tobacco money to cast doubt on smoking research. He edited Better Homes and Gardens and Liberty before going freelance in 1946, per Wikipedia.
Here’s the twist. The tobacco industry paid him to dispute the link between smoking and disease. On March 22, 1965, he testified to Congress criticizing the 1964 Surgeon General’s report on smoking. He also wrote a sequel, How to Lie with Smoking Statistics.
Statistician Alex Reinhart dug the story out of tobacco industry documents. Huff had been paid $9,000 by January 1968, Reinhart found. Macmillan agreed to publish the sequel in 1968. It never came out.
My take: that doesn’t sink the book. It proves its point. The man who wrote the manual used it for the other side.
Action item: Next time an expert explains away a health risk, look up who pays them. It takes two minutes.
Why Can a Survey or Study Sample Mislead You?
A sample with a built-in bias gives a confident answer about the wrong group of people. That’s Huff’s first chapter. His example: average earnings of a class of graduates, where the people who answered were likely the ones doing well, per SuperSummary’s chapter notes.
The health version is everywhere. Before-and-after photos show the people it worked for. A “9 out of 10 users loved it” survey asks people who kept buying it. That’s a teaching example, not a named product, but you’ve seen it.
The question is always: who didn’t get asked?
Action item: When you see a testimonial, ask how many people tried it and didn’t send one in.
What Is a “Well-Chosen Average” in Health Claims?
A well-chosen average picks whichever number tells the story the seller wants. Huff’s classic case is mean versus median income. One rich person lifts the mean; the median barely moves.
Weight-loss trials have a modern twin. The STEP 1 trial of semaglutide (Wegovy) enrolled 1,961 adults. Counting everyone who started, the drug group lost an average 14.9% of body weight at 68 weeks, versus 2.4% on placebo. If you count only people who stayed on treatment, the average was 16.9%, per the published trial.
Both numbers are true. They answer different questions. We explain the difference in our retatrutide vs Ozempic trial breakdown.
Action item: When you see a weight-loss percentage, look for the words “if people stayed on treatment” or “counting everyone”. If neither is there, assume the bigger one.
What Is the Difference Between Relative and Absolute Risk?
Relative risk tells you how much a risk changed; absolute risk tells you how big the risk was to begin with. Huff calls the gap “the little figures that are not there”. A percentage with no base is half a fact.
Take the ASCOT-LLA trial of atorvastatin (Lipitor) in 10,305 people with high blood pressure. It ran about 3.3 years. Heart attacks or heart deaths hit 3.0% on placebo and 1.9% on the drug, per an RxFiles summary of the trial. That’s a 36% relative drop. It’s also 1.1 points, or about 1 person in 91.
Lipitor ads led with the 36%. The fine print gave the 3-in-100 versus 2-in-100 version, as Mouseprint documented in 2008.
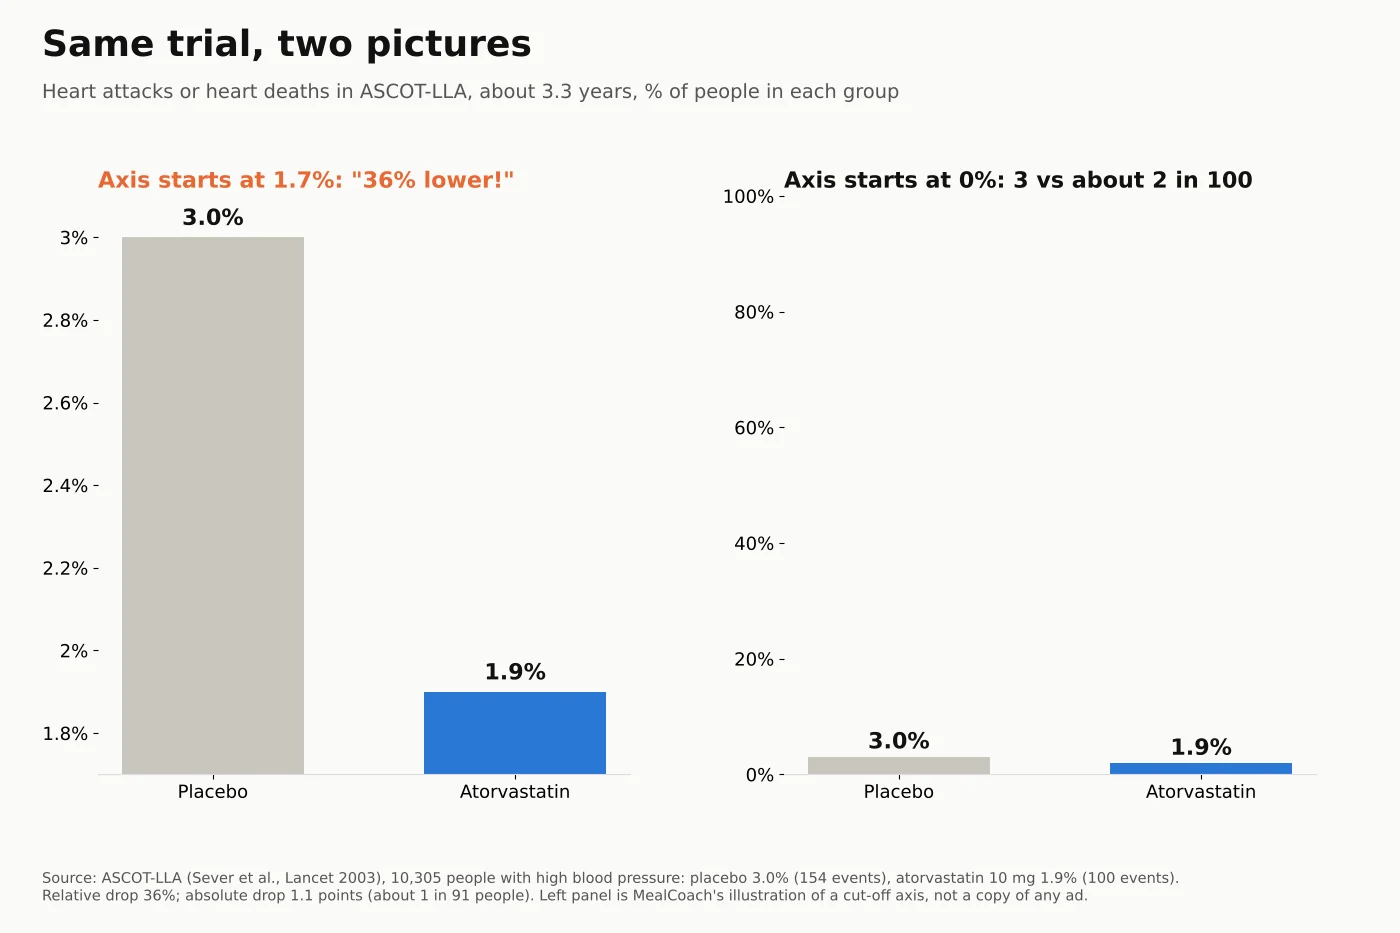
Neither number is a lie. One just feels bigger. Both matter for your decision, which is a conversation for your doctor.
Action item: For any “cuts your risk by X%” claim, ask: “Out of 100 people like me, how many does that change?”
Can a Health Scare Use the Same Trick?
Yes. Relative risk can make a small danger sound huge, and that can cause real harm. It’s the same missing-figure trick, aimed the other way. It isn’t only a marketing problem.
In October 1995, UK regulators warned that newer birth control pills carried a higher clot risk. The studies behind it suggested older pills had about half the risk of newer ones.
In absolute terms, deep-vein clots were about 25 per 100,000 women a year on newer pills. On older pills it was about 15, per a 2001 BMJ review.
In the first months of 1996, England and Wales recorded 6,198 more abortions than in the quarter before, a 16% rise. The BMJ review’s own headline: the pill’s risks are still small compared with those of pregnancy.
So the trick cuts both ways: it can sell a drug or scare people off one.
Action item: When a headline says a risk “doubled”, find the starting number before you react, then talk to your prescriber.
How Do Graphs Make Small Changes Look Huge?
A graph that cuts off the bottom of its axis makes a small change look like a cliff. Huff named it the “gee-whiz graph”. Look back at the chart above: the left panel is honest data with a dishonest frame.
His next chapter, “the one-dimensional picture”, is the cousin. Here’s our own illustration: draw a pill bottle twice as tall, and it also gets twice as wide. It looks four times bigger, even though the number only doubled.
Action item: Check where the y-axis starts on the next chart you see in an ad or post. If it isn’t zero, re-read the numbers, not the bars.
What Is a Semiattached Figure?
A semiattached figure proves one thing and lets you assume it proved another. Huff’s point: if you can’t prove your claim, prove something nearby and let readers connect the dots.
Supplements lean on this. In 2017, the FTC and New York’s attorney general sued the makers of the memory supplement Prevagen. They alleged its memory claims rested on a study that, overall, didn’t beat placebo on any measure of thinking, per the FTC’s announcement.
The company argued that good results in subgroups of its 218-person study backed its claims, per SupplySide Supplement Journal.
In 2024, a jury found none of the challenged memory claims had competent and reliable scientific support. A December 2024 court order barred eight of them, per NutraIngredients. The company said it would appeal. Slicing a study into subgroups until one looks good is a trick Huff would recognize.
Drug marketing has its own version: a drug that improves a blood test is sold as if it prevents the disease. The test is “semiattached” to the outcome you care about.
Action item: When something is “clinically shown”, ask: shown to do what, in whom, against what?
Does Correlation Prove Cause in Nutrition Studies?
No. Two things moving together doesn’t prove one causes the other, and food science learned this the hard way. Huff called it “post hoc rides again”.
Observational studies found that people who ate more beta-carotene-rich food got less lung cancer. So researchers tested beta-carotene pills in a trial called CARET, in 18,314 people at high risk. The pill group had 28% more lung cancers, and the trial was stopped 21 months early, per the 1996 trial report.
The vegetables were probably a marker of a healthier life, not a magic molecule. That’s why “people who eat X live longer” headlines deserve a raised eyebrow.
Action item: When a food study says “linked to”, ask what else the people eating that food might do differently.
Who Says So? The Sugar Industry Example
Who paid for a study can shape what it concludes and what it leaves out. “Who says so?” is the first of Huff’s five questions.
In 1965, the Sugar Research Foundation paid two Harvard nutritionists $6,500, about $48,000 in 2016 dollars. Their 1967 reviews in the New England Journal of Medicine blamed fat for heart disease and played down sugar. The funding wasn’t disclosed. UCSF researchers uncovered it in JAMA Internal Medicine in 2016, as Scientific American reported.
For more on how the food industry engineers what we crave, see our Salt Sugar Fat summary.
Action item: Scroll to the bottom of the next study you read about. Find the funding line.
How Do You Talk Back to a Statistic?
Huff’s last chapter gives five questions that work on any number. As listed in SuperSummary’s notes on the chapter:
- Who says so? Look for bias, and for big names borrowed for credibility.
- How does he know? Check the sample: too small, or the wrong people?
- What’s missing? The base number, the comparison, the type of average.
- Did somebody change the subject? A blood test isn’t a heart attack; a link isn’t a cause.
- Does it make sense? Be wary of oddly precise figures and long-range guesses.
Here’s a worked example. It’s an illustration we made up, not a real ad: “New diet pill cuts belly fat 50%!”
- Who says so? The company selling it.
- How do they know? 20 people, no placebo group.
- What’s missing? 50% of what? Maybe 2 cm down to 1 cm.
- Changed subject? “Belly fat” on one scan, not weight or health.
- Makes sense? Half your belly fat from a pill? No.
Two minutes, five questions, and the claim falls apart.
Action item: Screenshot the five questions. Run the next diet headline you see through them.
Where How to Lie with Statistics Falls Short
The book is dated, its author was compromised, and it can tip readers into distrusting every number.
- Old examples. Its salary figures are from the 1950s. Readers who know the basics won’t find much new, notes a reviewer at Effortmark who no longer recommends it.
- The tobacco problem. Huff used his toolkit to muddy real evidence about smoking.
- Cynicism. Economist Tim Harford argues the book makes statistics look like a magic trick. “Scepticism is all very well, but not if it curdles into cynicism,” he wrote in 2022.
My take: Harford is right. The goal isn’t to doubt every number. It’s to ask better questions, then trust the numbers that survive them.
Action item: Pair this book with a source you trust. Use Huff’s questions to check it, not to dismiss it.
Why Read How to Lie with Statistics in 2026?
Because health claims are louder than ever, and regulators have noticed. In September 2025, the FDA sent about 100 cease-and-desist letters over misleading drug ads, plus thousands of other letters, per Drugs.com.
Meanwhile, GLP-1 headlines, supplement ads and glucose influencers all speak in percentages. Our Glucose Revolution summary shows how far an 11-person study can travel.
Action item: Pick one health account you follow. Check its last three claims against Huff’s five questions.
Quick Answers
What is How to Lie with Statistics about? It’s a 1954 book by Darrell Huff showing how true numbers mislead through biased samples, chosen averages, missing comparisons, stretched graphs and false cause-and-effect. It ends with five questions to check any statistic.
What are the five questions in How to Lie with Statistics? Who says so? How does he know? What’s missing? Did somebody change the subject? Does it make sense?
What is the difference between relative and absolute risk? Relative risk is the percent change in risk. Absolute risk is the actual chance. In ASCOT-LLA, a 36% relative drop meant 3.0% versus 1.9% over about 3.3 years.
What makes a graph misleading? Usually a y-axis that doesn’t start at zero, or pictures scaled in two dimensions. Both make small differences look big.
Is How to Lie with Statistics still worth reading? Yes, as a fast primer. Its examples are dated, and its author later worked for the tobacco industry. Read it as a toolkit for questions, not a reason to distrust all data.
The 5-Minute Version: How to Lie with Statistics Summary (Screenshot This)
- The idea: true numbers can still mislead through framing.
- Biased sample: ask who didn’t get asked.
- Chosen average: check which group and which average.
- Missing figures: “36% lower” was 3.0% versus 1.9% in ASCOT-LLA.
- Scares too: a 1995 pill clot warning meant about 15 versus 25 per 100,000 women a year.
- Graphs: check where the axis starts.
- Post hoc: beta-carotene looked protective, then the CARET pill group got more lung cancer.
- Talk back: who says so, how do they know, what’s missing, did the subject change, does it make sense?
Conclusion
If this How to Lie with Statistics summary leaves you with one idea, make it this. Most misleading health claims are true numbers in the wrong frame. A percentage without a base. An axis without a zero. A link sold as a cause.
Huff’s own life is the warning label. The tricks work on smart people, including the man who named them. The fix isn’t cynicism. It’s five questions, asked calmly.
Your one step this week: run one health headline through Huff’s five questions before you share it.
So tell me: what’s the most misleading health number you’ve seen lately?
This is a book summary, not medical advice. Talk to your doctor before you change any medicine.
Sources
- Wikipedia: How to Lie with Statistics (Norton, 1954; Irving Geis; sales)
- Wikipedia: Darrell Huff (career; March 22, 1965 testimony)
- Alex Reinhart (Oct 4, 2014): The history of How to Lie with Smoking Statistics
- Signature Clippings: Darrell Huff quotes
- ALiEM Bookclub: How to Lie with Statistics (statisticulation)
- SuperSummary: Chapter 1, The Sample with the Built-in Bias
- SuperSummary: Chapter 10, How to Talk Back to a Statistic
- Wilding et al., STEP 1 (semaglutide 2.4 mg, 68 weeks): estimands
- RxFiles: ASCOT-LLA summary (Sever et al., Lancet 2003)
- Mouseprint (Feb 4, 2008): Lipitor ad and its fine print
- Drife, BMJ (2001): The third generation pill controversy
- FTC (Jan 9, 2017): FTC and New York Attorney General charge marketers of Prevagen
- SupplySide Supplement Journal (May 30, 2018): Prevagen maker asks appeals court to affirm dismissal
- NutraIngredients (Dec 12, 2024): Prevagen ordered to remove memory-improvement claims
- Omenn et al., JNCI (1996): Risk factors for lung cancer and intervention effects in CARET
- Scientific American (2016): Sugar industry secretly paid for favorable Harvard research
- Effortmark: Book review, How to Lie with Statistics
- Tim Harford (Jan 27, 2022): How to truth with statistics
- Drugs.com (Sep 2025): FDA sends 100 cease-and-desist letters in DTC ad crackdown
 MealCoach